
Econometric Scenario Generators (ESG) are key instruments in financial risk management. As such, the quality and robustness of the generated scenarios are important factors for reliable risk management.
A key indicator of ESG quality is a reasonable correlation between economic variables and the preservation of stylized facts in the generated scenarios. In this post, we examine the robustness of ESGs, which is another important measure of ESG quality. Robustness ensures that a small change in the ESG input causes a relatively small change in the generated economic scenarios.
What inputs does an ESG have? One of the key inputs is the state of the economy at the starting point of the simulation. In other words, the values of the economic variables at the initial point (time zero) of the simulation.
The traditional ESGs are primarily based on the Vector Autoregressive (VAR) modeling framework or some variation of it. Therefore, their robustness can be assessed by examining the specification of the VAR model’s linear functional form.
In contrast, the AI-based ESGs are black-box models, lacking a transparent analytical framework for directly evaluating their robustness. To examine the robustness of our AI-based ESG, we compare the distributions of the scenarios generated using different inputs to the ESG.
As a side note, Merriam-Webster defines the adjective robust as “capable of performing without failure under a wide range of conditions.” This is a vital attribute of an ESG, which we will explore in this blog.
AI-based ESG Robustness With Respect to the Starting Point
To assess the robustness of our AI-based ESG, we perform two simulations of economic scenarios using 2024 Q4 and 2025 Q1 as the starting point.
Economic Conditions at the Starting Points of the Scenarios
Let’s begin by comparing the actual economic variables between 2024 Q4 and 2025 Q1.
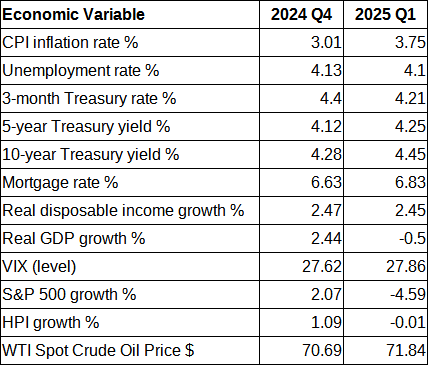
Most of the economic variables did not have any significant change between 2024 Q4 and 2025 Q1. However, real GDB growth experienced a noticeable decline in the later quarter, turning negative in Q1 2025. It was largely driven by a surge in imports due to anticipated tariff hikes later in the year. Additionally, HPI growth decelerated in Q1 2025, which is likely driven by the economic uncertainty surrounding the expected tariff rollout. S&P 500 growth also had a noticeable change between these two quarters. However, given the volatile nature of the stock market, it shouldn’t have a significant impact on the generated scenarios.
Distributions of the Generated Scenarios
Next, we generated 1000 economic scenarios for each of these two starting points using our AI-based ESG. The generated scenarios have a 12-year horizon for both initial points.
To compare the two sets of generated economic scenarios (one set per starting point), we looked into the distributions of the scenarios for these two sets. Specifically, we compared the quartiles of economic variables between the two distributions.
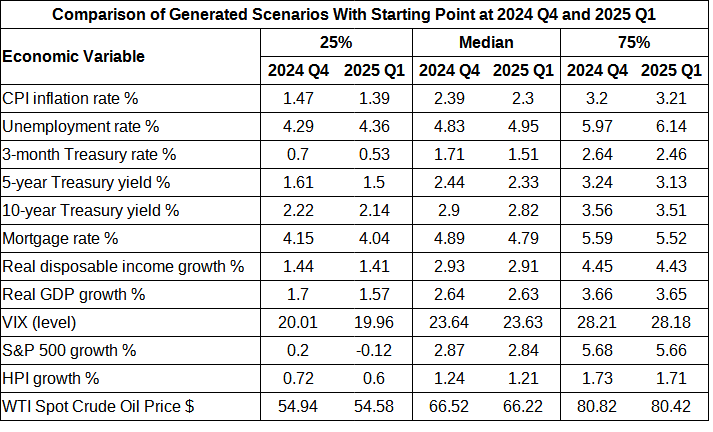
A glance through the table with the quartiles from the two distributions side by side reveals that the two distributions are indeed close to each other. What’s more interesting is that the change of the economic variables within each quartile generally follows the stylized facts.
For example, the unemployment rate for 2025 Q1 scenarios is higher than for 2024 Q4 scenarios in all quartiles, while the interest rates (notably the Treasury 3-month rate) are lower. This means that the generated scenarios for 2025 Q1 generally represent a slightly weaker economy than the scenarios for 2024 Q4.
Consistent with that, the real GDP growth is slower and real disposable income is lower in the 2025 Q1 scenarios. Besides, stock market performance and house price growth are slightly weaker in the 2025 Q1 scenarios as well.
As such, a small change in the starting point of our AI-based ESG results in a small change in the distributions of the generated scenarios. Moreover, the observed changes are generally consistent with the well-known stylized facts for economic variables.
How About a Large Change in the ESG Inputs?
To further ensure the robustness of our AI-based ESG, we examined how the generated economic scenarios change when using a significantly different input for the ESG. For that purpose, we generated scenarios with two very different starting points: 2024 Q4 and 1984 Q4.
Economic Conditions at the Starting Points of the Scenarios
Let’s begin with the comparison of economic variables between 2024 Q4 and 1984 Q4.
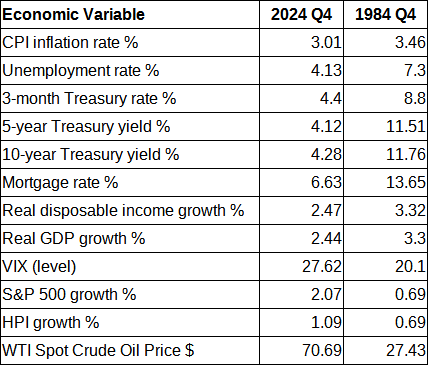
Besides the obvious differences in the economic metrics, these two periods had significantly different economic dynamics.
Following the post-pandemic rebound, 2024 was a year of moderated growth. Inflation remained a key concern, and the unemployment rate edged up compared to the previous year.
On the contrary, in 1984, the economy was booming following the 1981-1982 recession due to efficient monetary and fiscal policies. The unemployment rate had been declining from its recessionary peak, and the inflation, while still elevated, was significantly lower compared to prior years.
Distributions of the Generated Scenarios
As before, we simulated 1000 scenarios with a 12-year horizon for these two starting points. Then, we compared the quartiles of the distributions from these two sets of generated scenarios.
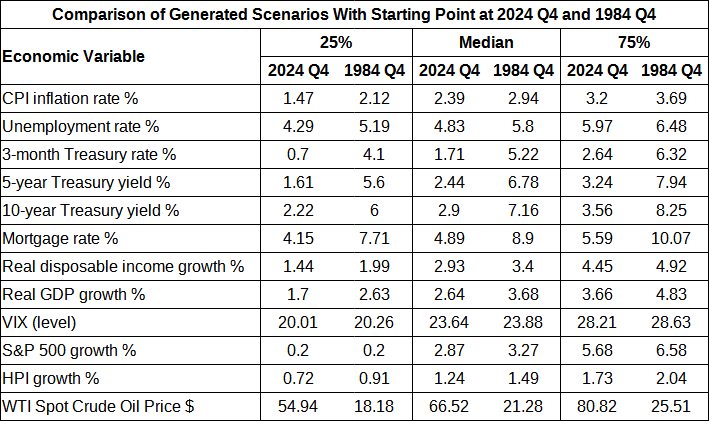
Except for oil prices, all other economic variables are higher for the 1984 Q4 simulation compared to 2024 Q4 across all quartiles. Specifically, the interest rates are significantly higher for the 1984 Q4 simulation. This aligned with the rapidly expanding economy at the time, as the job market was improving while inflation was still elevated. Similarly, the faster growth in real disposable income, real GDP, and house prices, along with a performing stock market, is a result of the booming economy in 1984 Q4 and beyond. Finally, the lower oil prices further contributed to the easing inflation in the generated scenarios for 1984 Q4.
Summary
Robustness is an important attribute of ESGs. While traditional ESGs suggest robustness through their linear structure, assessing the robustness of AI-based ESGs is more challenging due to their opaque nature.
To demonstrate the robustness of our AI-based ESG, we performed two experiments:
- We generated scenarios for two closely related starting conditions and found that the distributions of the generated scenarios are very close.
- Conversely, scenarios generated for two markedly different starting points have significantly diverged distributions.
Moreover, in both experiments, the difference between the generated scenarios aligned well with the stylized facts observed in the historical data.
Notes
We sourced the economic data shown in this blog from Fred at the time this study was conducted. Since then, the data in Fred may have changed due to revisions by the data providers.
We periodically enhance our AI-based economic scenario generator. For this study, we used the latest stable version of our ESG model. The future versions of the model may produce slightly different results due to revisions in training data and refinements in methodology.