
Economic scenarios are often highly complex, shaped by monetary policy, geopolitical tensions, bilateral trade agreements, labor market dynamics, and a host of other interrelated factors. This complicated reality of economics often requires a simplified interpretation to understand the underlying patterns and dynamics within scenarios. Stylized facts serve as guiding stars in navigating vast amounts of economic data and providing key insights into the behaviors and relationships that drive economic indicators.
We explore stylized facts in economic scenarios by analyzing historical trends and correlations of the economic indicators. We compile a list of qualitative stylized facts that can provide an intuitive interpretation of historical and generated economic scenarios.
Stylized Facts for Interest Rates
Interest rates have the most stylized facts as they directly or indirectly impact every aspect of the economy. The Fed Funds rate stands out as a key benchmark among the broad spectrum of interest rates. This overnight borrowing rate between financial institutions is controlled by the Federal Reserve Board (FRB or the Fed). The Fed Funds rate is set primarily based on the current and foreseeable future state of the economy.
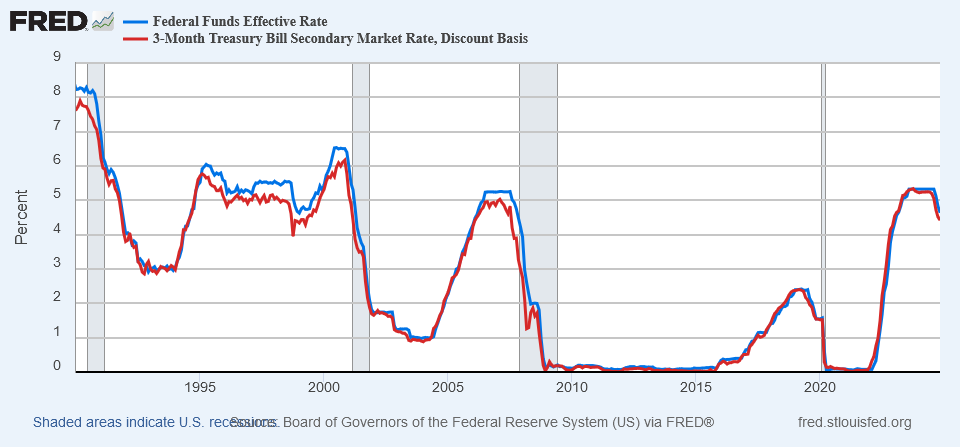
Short-term interest rates, such as Treasury 1-month and 3-month, closely follow the Fed Funds rate. In fact, the correlation between the Fed Funds rate and the Treasury 3-month rate is over 99%.
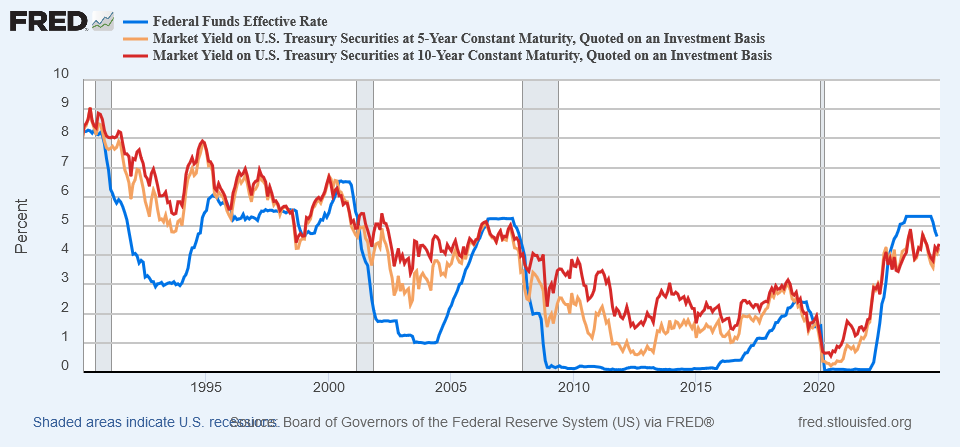
Longer-term rates, such as 5-year and 10-year Treasury rates, are less correlated with the Fed Funds rate. Generally, long-term rates are higher than short-term rates (such as the Fed Funds rate), shaping a normal yield curve. However, in a high-rate environment, short-term rates can be higher than longer-term ones, forming an inverted yield curve.
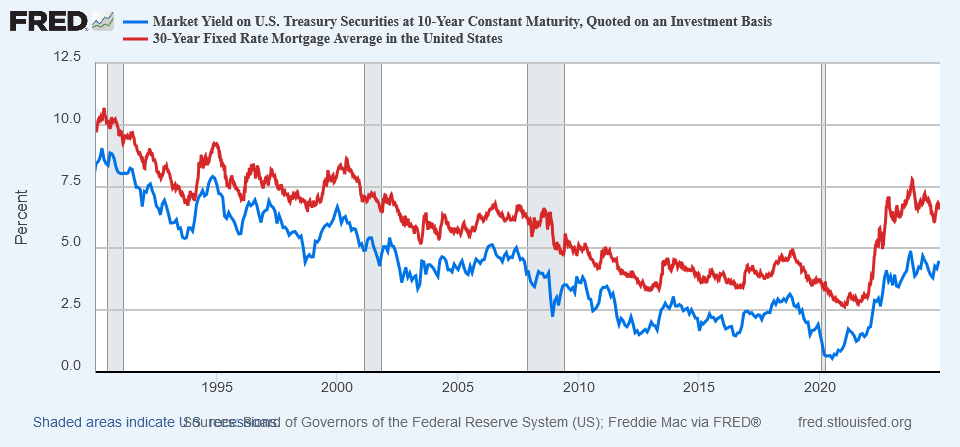
Mortgage rates mainly follow long-term Treasury rates with a level shifted up. For example, the 30-year mortgage rate tracks the 10-year Treasury rate with a 1.5% – 3% spread.
Interest Rate and the Economy
Let’s explore a few stylized facts that capture the impact of interest rates on inflation and employment.
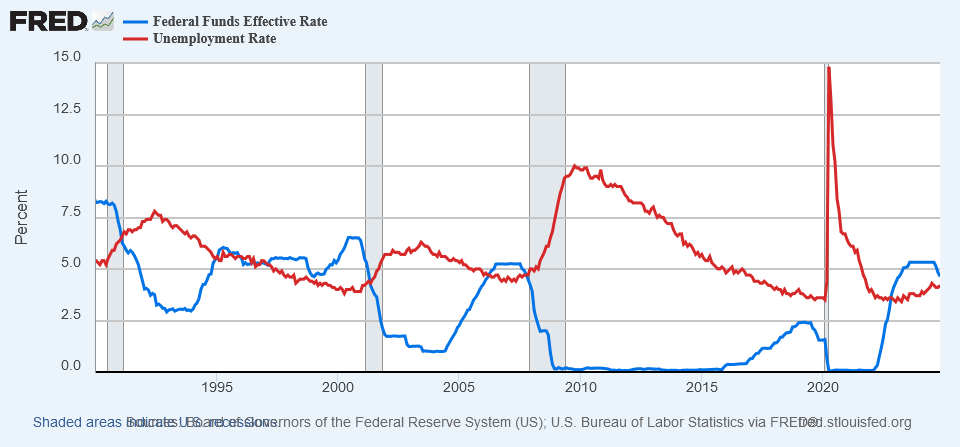
The Fed Funds rate is an important tool for managing inflation. When the inflation rate is high or on an increasing path, the Fed raises the Fed Funds rate to control inflation. A higher Fed Funds rate increases borrowing costs for businesses and consumers, resulting in less spending and a lower inflation rate.

On the other hand, when the unemployment rate is high, the Fed reduces the rate to stimulate the economy and improve the labor market.
The unemployment rate and inflation often have an inverse relationship, meaning that lower unemployment rates are associated with higher inflation rates.
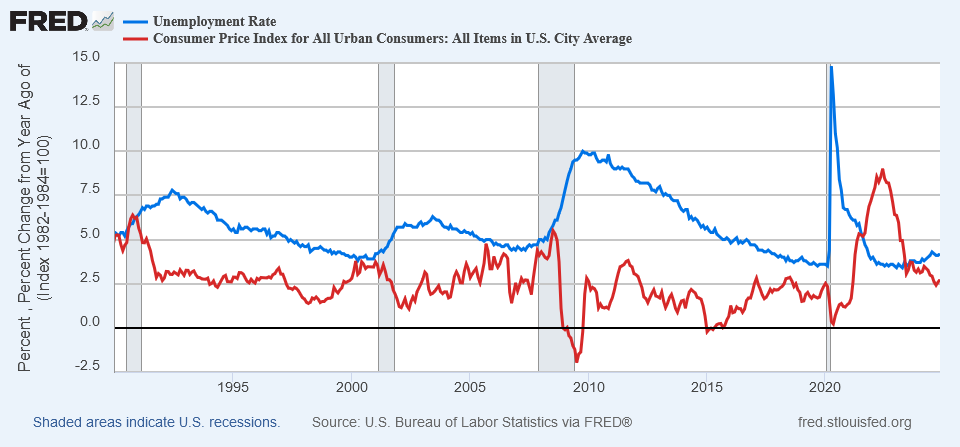
The interest rate (specifically the Fed Funds rate) plays an important role in the relationship between unemployment and inflation. It acts as a double-edged sword since a lower interest rate may boost employment but also lead to higher inflation, while a higher interest rate helps control inflation at the cost of potentially increasing unemployment.
As we explore more stylized facts among economic indicators, interest rates often shape the dynamics behind the scenes, even when they are not explicitly mentioned.
Unemployment Rate vs GDP Growth
The unemployment rate typically moves inversely with real GDP growth: as unemployment rises, economic growth tends to slow or contract.
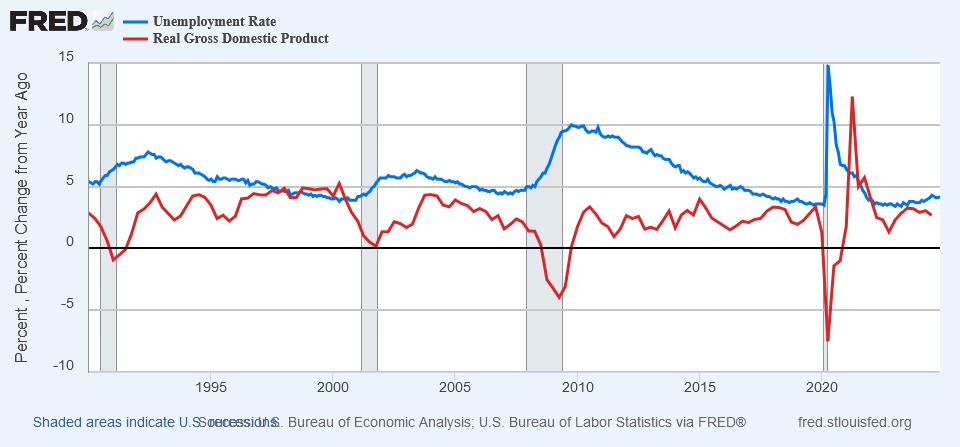
This stylized fact becomes especially evident during downturns, when surging unemployment is often paired with stagnant or negative GDP growth. A return to positive GDP growth signals the beginning of an economic recovery. However, the labor market tends to lag as it takes a longer time for unemployment to return to its pre-recession levels.
Inflation vs Real Disposable Income
Generally, the real disposable income has a growing trend. The growth rate may vary depending on the state of the economy, particularly inflation. For example, during high inflationary periods, the real disposable income has a slower growth due to a lag in wage increases.
On the other hand, during the deflationary periods, when prices of goods and services fall, the real disposable income may have a temporary sharp increase due to negative inflation. Note that the nominal disposable income (actual dollar value) may not even change. However, it has more buying power due to lower prices of goods and services, which translates into a higher real disposable income.
Another stylized fact is that during economic downturns (usually a reason for deflation), government stimulus and tax credits may further support real disposable income growth.
Stylized Facts for Stock Market Indicators
The S&P 500 and VIX are closely watched market indicators that offer early signals about the direction of the broader economy. While the S&P 500 Index tends to rise over the long term, it can experience significant volatility and prolonged downturns. VIX measures the stock market volatility over the next 30 days, which may increase or spike during periods of uncertainty.
The S&P 500 index growth and VIX are negatively correlated. The strength of the correlation depends on the granularity of the stock market data. For instance, the correlation is stronger in daily data, where the S&P 500 index growth is measured using daily open and close levels. In contrast, with monthly or quarterly data, the correlation between S&P 500 index growth and VIX is weaker since the longer measurement periods allow the stock market to recover from losses.
Stylized Facts for House Price Index
House prices generally have an upward trend with seasonal effects. Usually, its growth rate is faster during spring and summer seasons and much slower in fall and winter.
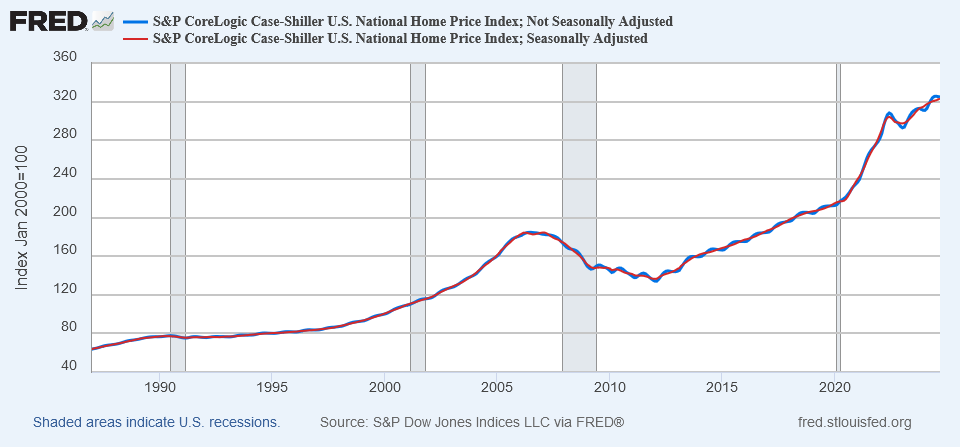
Housing prices strongly depend on supply and demand. During periods of tight supply and high demand, HPI growth is faster. Conversely, during the recessionary periods, when supply increases and demand falls, house prices may decline.
A lower mortgage rate may accelerate HPI growth due to more affordable mortgages and increased demand. However, a high mortgage rate may still result in faster HPI growth due to a lower supply, as homeowners may be reluctant to sell their property with an existing low-rate mortgage. This is known as the rate lock-in effect.
Rising real disposable income is a key driver of house price growth. When income increases, whether from a booming economy or tax reforms that reduce the tax burden, households gain greater purchasing power. This boost in affordability often translates into stronger demand for housing, which in turn pushes prices upward.
Do the Stylized Facts Always Hold?
The stylized facts outlined above reflect broad relationships among economic indicators, but they do not always hold in practice. External shocks or third factors can disrupt these patterns. A notable example is the stagflation of the 1970s, when the U.S. economy faced simultaneously high unemployment and inflation, alongside volatile interest rates. One key driver of this anomaly was a sharp surge in oil prices, which triggered cost-push inflation and undermined the typical inverse relationship between inflation and unemployment.
Summary of Stylized Facts in Economic Scenarios
Stylized facts distill complex economic realities into simplified patterns, helping to uncover underlying dynamics and relationships. We summarized the stylized facts described above into bullet points.
- Interest rates:
- Short-term interest rates strongly correlated with the Fed Funds rate.
- Longer-term rates are less correlated with the Fed Funds rate.
- In a low-rate environment, the long-term rates are generally higher than the short-term rates, forming a normal yield curve.
- In a high-rate environment, long-term rates are more likely to be less than short-term rates, resulting in an inverted yield curve.
- Mortgage rates track long-term rates, usually being 2% to 3% higher.
- Interest Rate and the Economy:
- A high interest rate lowers inflation by reducing consumer borrowing and spending.
- Lower interest rates stimulate the economy and reduce unemployment.
- Unemployment and inflation generally have an inverse relationship.
- Interest rates influence the unemployment-inflation relationship, balancing employment and inflation.
- The unemployment rate and real GDP have an inverse relationship; higher unemployment leads to a slower or negative GDP growth.
- Inflation vs. Real Disposable Income:
- Real disposable income generally grows but varies with inflation.
- During deflation, real disposable income may temporarily spike.
- S&P 500 and VIX are negatively correlated; the strength of the correlation depends on data granularity (stronger in daily data).
- House Price Index (HPI):
- House prices generally rise with seasonal effects.
- HPI growth depends on market supply and demand.
- Lower mortgage rates can accelerate HPI growth due to more affordable mortgages.
- High rates can also result in HPI growth due to the rate lock-in effect (tight supply).
Finally, note that there are many other stylized facts involving oil prices, metal markets, and currency exchange rates not covered here.
Our AI-generated macroeconomic scenarios reflect these stylized facts, providing a coherent dynamics of economic indicators. Reach out to find out more about these generated scenarios.