
Metals are essential components of modern economies, shaping industries from manufacturing to technology. To help businesses anticipate market shifts, we developed an AI-powered scenario generator that simulates monthly prices for industrial and precious metals.
The generated scenarios provide monthly average prices of the following metals:
- Industrial metals:
- Aluminum
- Iron ore
- Copper
- Lead
- Tin
- Nickel
- Zinc
- Precious metals:
- Gold
- Platinum
- Silver
By simulating real-world price paths, the generator enables users to assess risks, stress-test strategies, and identify opportunities in both industrial and precious metals.
Evolution of Metal Prices in the Generated Scenarios
To provide a high-level view of the generated price scenarios, we illustrated the evolution of price distribution for each metal.
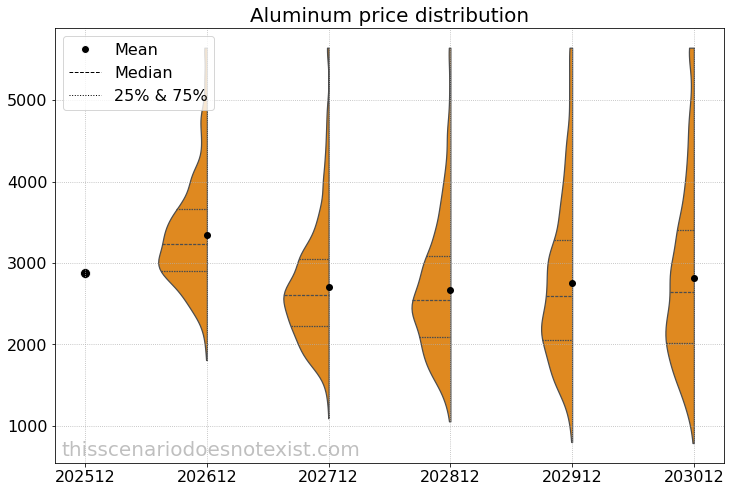
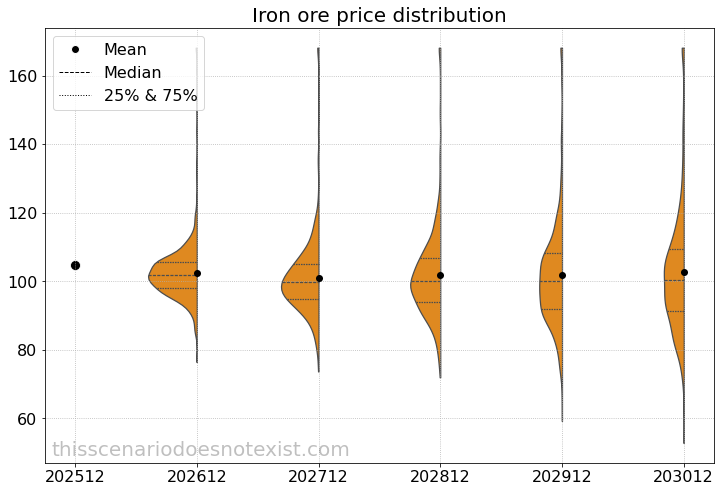
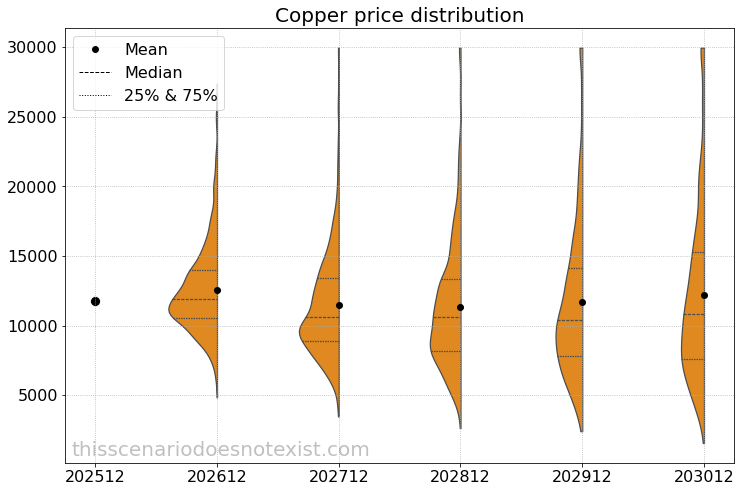
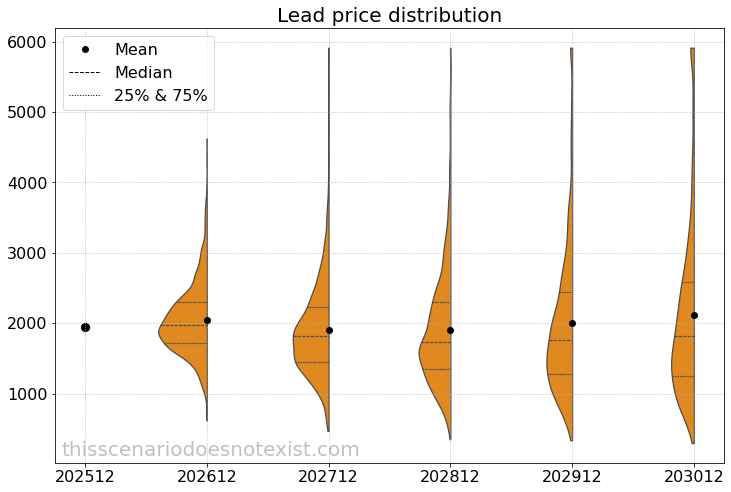
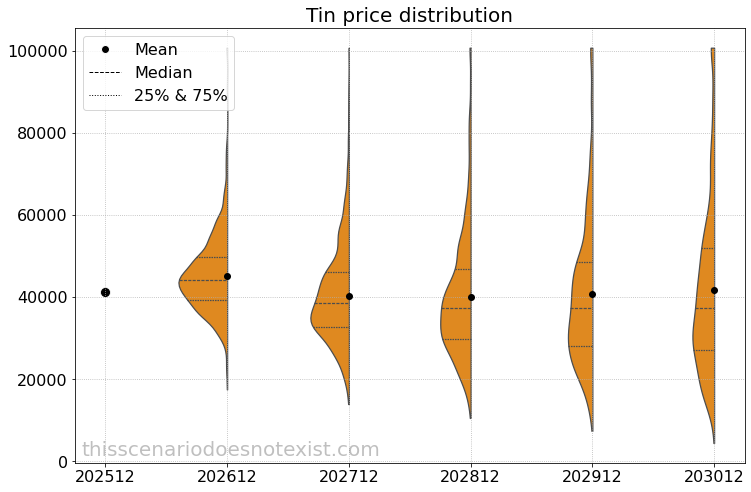
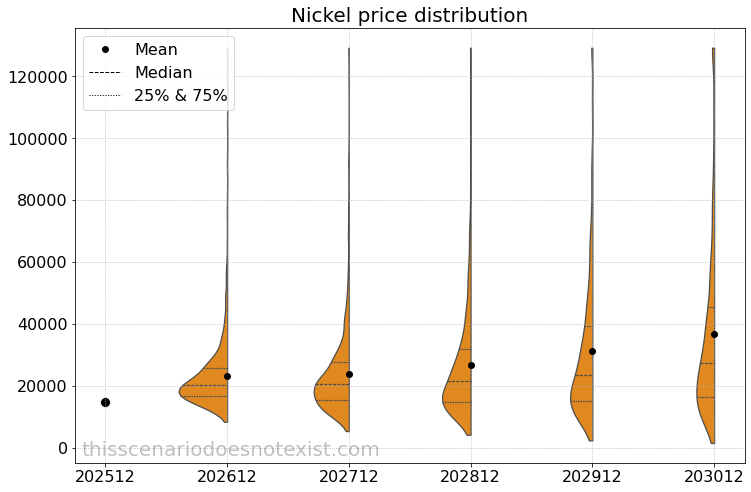
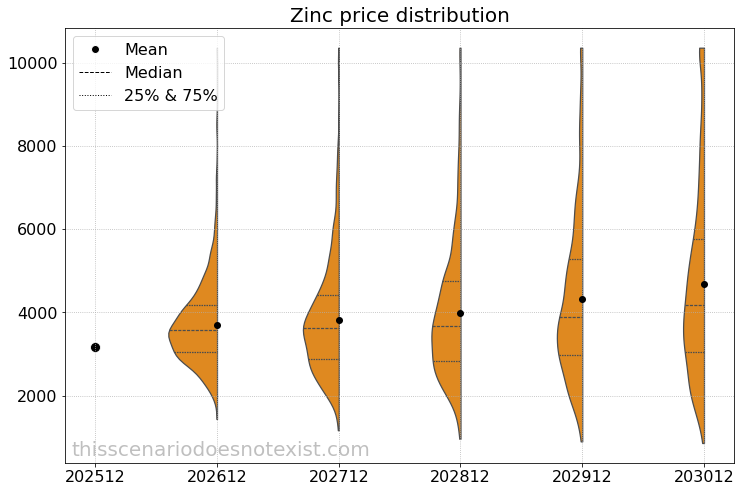
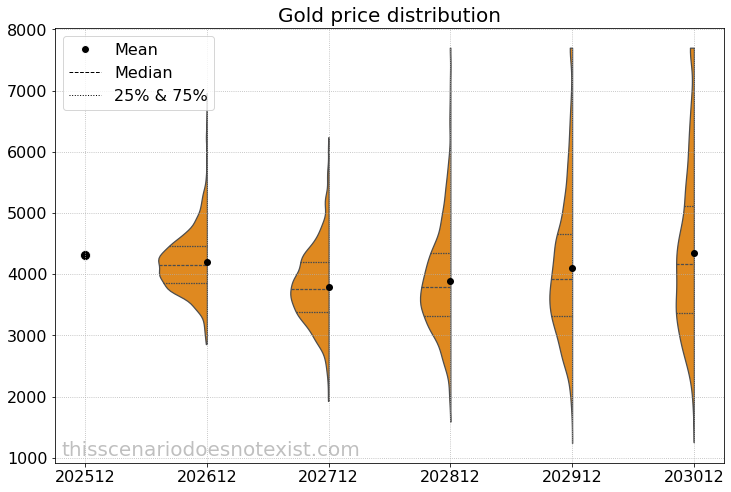
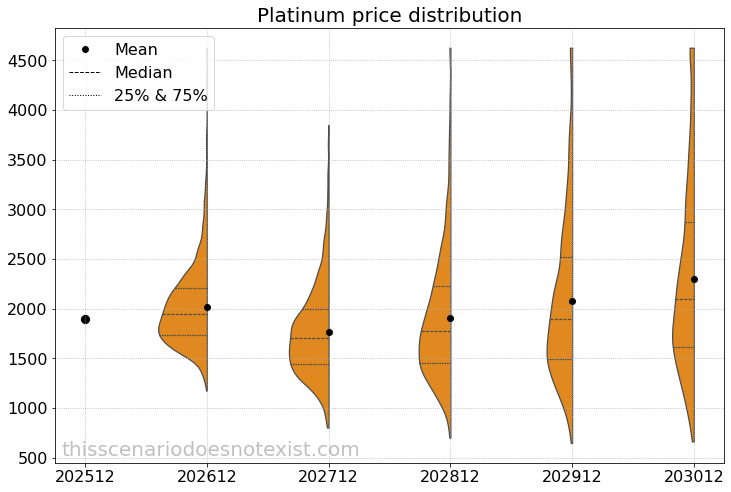
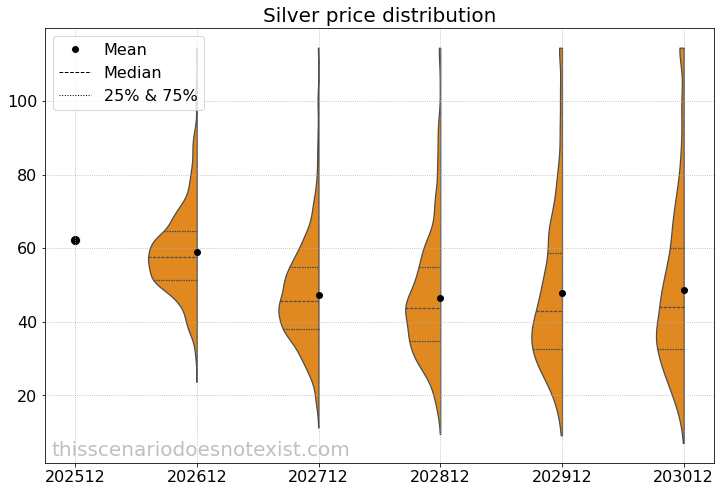
We generated 1,000 scenarios for metal prices, beginning in December 2025 (month zero) and extending over a 5‑year horizon. Then, we plotted the price distribution at each 12-month interval for each metal in the form of a violin chart.
The violin charts illustrate the shape of the distribution at a time slice and include markers for mean, median, and the 25th and 75th percentiles. To avoid extreme outliers distorting the visualization, the generated prices were capped at the 99th percentile, ensuring the main body of the distribution remains clear.
Distributions of Simulated Industrial Metal Prices
First, we illustrated the distributions for the generated industrial metal prices.
Aluminum
Iron ore
Copper
Lead
Tin
Nickel
Zinc
Distributions of Simulated Precious Metal Prices
Next, we demonstrated the distributions for the generated precious metal prices.
Gold
Platinum
Silver
Correlations in the Generated Scenarios
A key property of the metal price generators is to maintain reasonable correlations between simulated metal prices. In the heatmap below, we demonstrate average pairwise correlations across all scenarios.
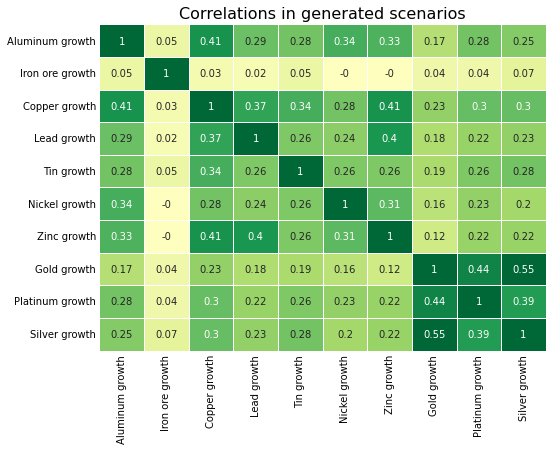
We used Spearman correlation to mitigate the influence of outliers. Notably, the more widely used Pearson correlation produced similar results.
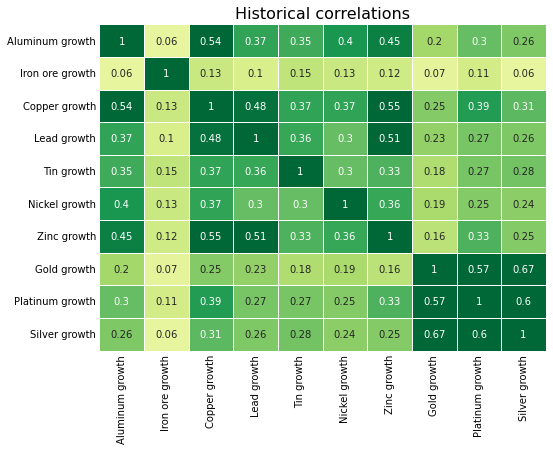
For comparison, we also present the historical correlation of the metal prices.
Summary
Generated scenarios from our AI‑based model illustrate how metal prices can evolve over time. We examine correlations across different metals in the simulated paths and compare them with the historical correlations.
To maintain a robust framework, we periodically revise and enhance our models. Therefore, the results presented here may be based on our older version of the scenario generator. Contact us for additional questions about the generated metal price scenarios or models.