
We outline four economic scenarios and examine how the key macroeconomic variables evolve within each. The example scenarios described here are randomly selected from thousands of scenarios generated by our proprietary AI model.
In all illustrated economic scenarios, 2025 Q4 is the last actual period, and 2026 Q1 is the first generated period. For this discussion, we limited the scenario examples to 5 years.
For a larger set of generated economic scenarios, we also analyze the distributions and correlations of the macroeconomic variables.
The illustrative examples of prior-year economic scenarios are available under the 2025 scenarios.
Economic Scenario 1: Cracks in the Foundation
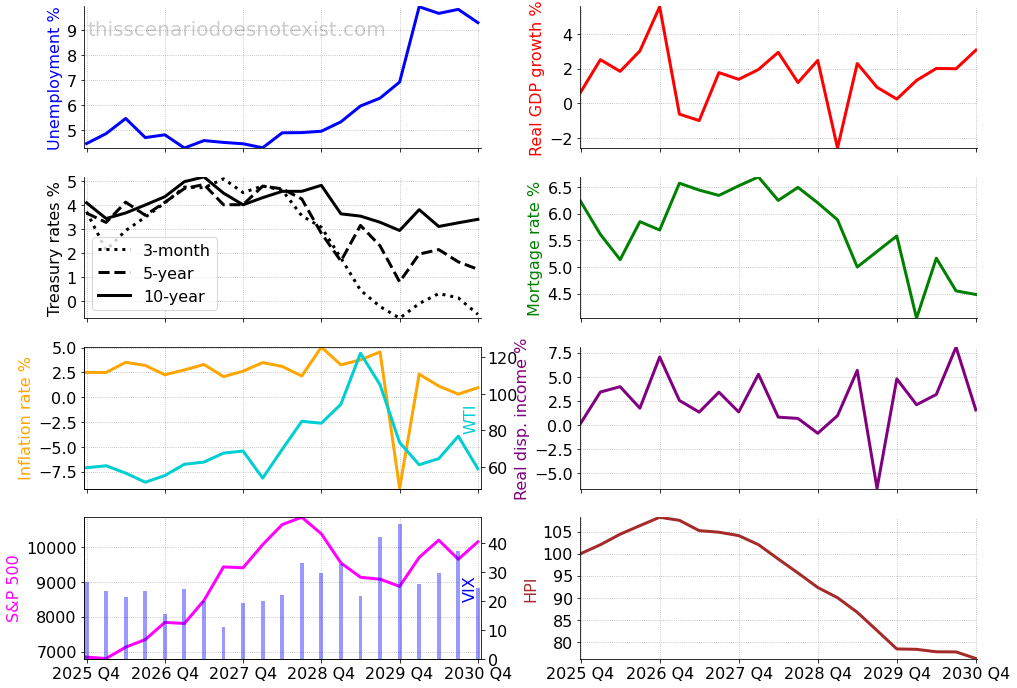
The unemployment rate stays relatively low during the first half of the scenario, then gradually increases in the second half, reaching nearly 10%. Interest rates remain elevated in the first half, then decline in the second half to stimulate the weakening economy. The Treasury 3-month rate declines to near 0%.
The inflation rate hovers around 2.5% with some occasional spikes to 5%, followed by a sharp disinflation in the second half. The oil price gradually increases to $120, then drops to $60 as the economy weakens.
The stock market gains during the first half of the scenario, then declines in the second half. The VIX climbs above 40 as the stock market becomes volatile later in the scenario.
Real GDP growth shows early signs of cracks in the economy, with two consecutive declines in the second year of the scenario. Later, it has a sharper drop as the economic downturn accelerates. Similarly, real disposable income declined sharply during the peak of unemployment.
The mortgage rates stay elevated and then gradually decline in the second half of the scenario, following the long-term Treasury rates. The house prices start to decline from the second year of the scenario, likely due to higher mortgage rates and a weakening economy. The HPI decline accelerates later as the unemployment rate picks up.
Economic Scenario 2: The False Summit
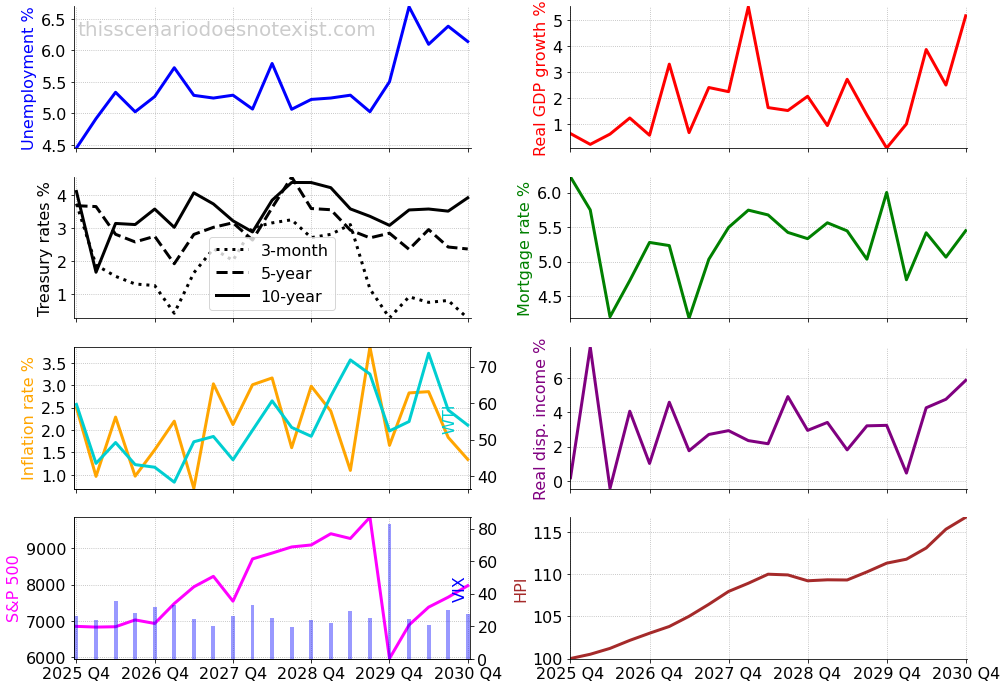
The unemployment rate stays somewhat elevated between 5% and 6%, then increases above 6% towards the end of the scenario. The Treasury 3-month rate initially decreases to support the slowing economy, then increases to control the higher inflation, then drops again as the unemployment rate jumps.
The stock market generally moves higher during the first few years, experiencing some volatility along the way. Then, it drops around 30% as the unemployment rate suddenly jumps. The VIX spikes above 80, then calms down as the stock market starts to recover.
The real GDP growth reflects an unstable economy with near-zero growth in some quarters and sudden spikes to 5% growth in other quarters. The real disposable income tells a similar story, exhibiting a slow growth with sudden spikes above 4%.
The mortgage rate declines below 6%, generally following the long-term Treasury rates. The housing market shows slow growth, with some flat periods along the way, echoing the struggling economy.
Economic Scenario 3: The Stagflation Cyclone
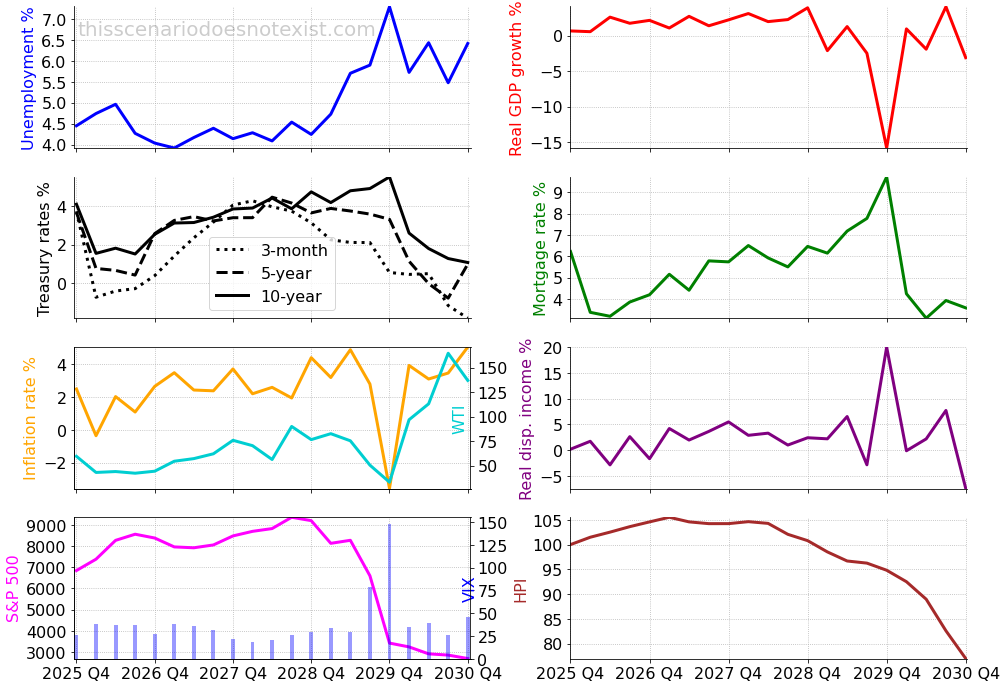
The unemployment rate shortly increases to 5%, then declines back below 4.5%. However, in the second half of the scenario, the unemployment rate increases to 7%, then settles at around 6%.
The short-term rate sharply declines to support the worsening labor market, then increases as the unemployment rate improves and the inflation picks up. Later, the Treasury 3-month rate declines again to boost the struggling labor market. However, the inflation increases too, creating a stagflationary environment.
The stock market climbs slowly before dropping sharply as the unemployment rate spikes, driving the VIX to a record 150 during the downturn.
Real GDP growth is relatively stable at 2%-3% during the first half of the scenario, then drops up to 15% in the second half as unemployment spikes. However, the real disposable income jumps 20% during the second half, likely due to government subsidies and support.
The mortgage rates dip below 4%, then gradually increase to 9% before dropping below 4% again. The house prices initially increase 5%, then gradually decline over 20% as mortgage rates increase and the labor market worsens.
Economic Scenario 4: The Deep Freeze
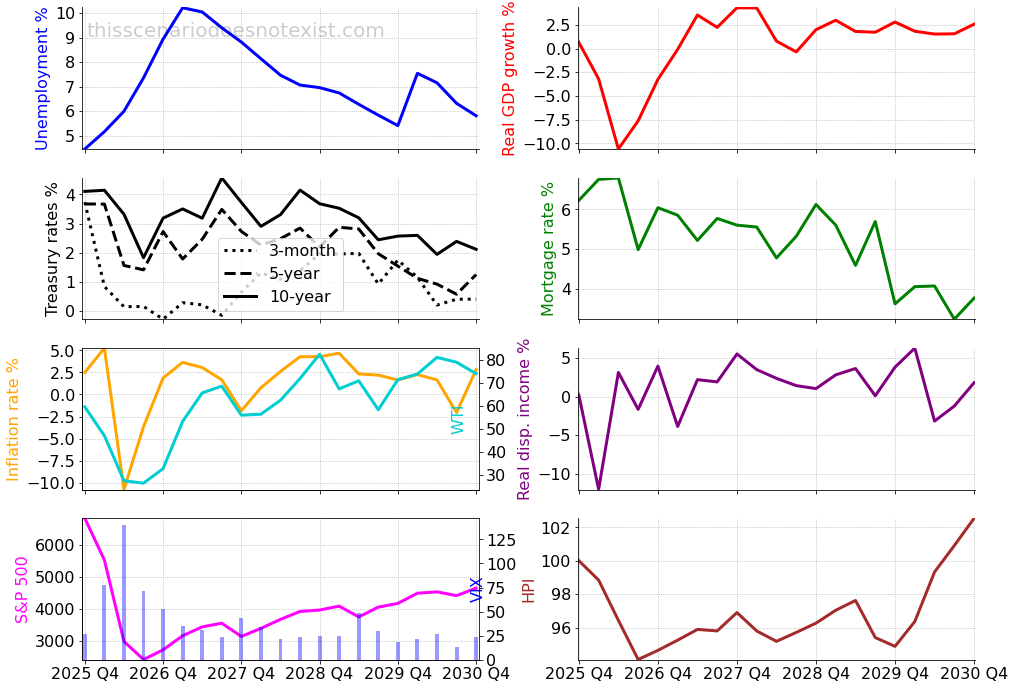
The unemployment rate increases, reaching 10% in the second year of the scenario. Then it starts a slow recovery, achieving 6% towards the end of the scenario.
The short-term interest rate drops to a near-zero level during the first two years to support the economy, then increases to 2% as the labor market improves and inflation increases. Later, the Treasury 3-month rate drops again to further boost the economy.
Inflation flips into outright deflation during the first year due to the economic downturn. Later, it recovers, staying volatile between 0% and 5%. The oil price mainly moves in tandem with inflation.
The stock market undergoes a severe drawdown of approximately 60%, followed by a partial recovery over the remainder of the horizon. VIX spikes to an unprecedented 130, then gradually recedes with a few lower-magnitude surges.
Real GDP growth contracts by 10% before recovering into positive territory, where it remains volatile, fluctuating between 0% and 4%. Similarly, real disposable income growth drops 10%, then gets back to near zero while oscillating within a broader range of -5% to 5%.
Mortgage rates gradually decline below 4%, tracking a broader downward trend in long-term Treasury yields. Concurrently, housing prices compress by approximately 5%, entering a multi-year period of stagnation before recovering toward the end of the scenario.
Conclusion
The illustrated scenario examples were produced by our AI-based economic scenario generator. They maintain coherent relationships between macroeconomic variables and adhere to stylized facts such as the relation between inflation and short-term interest rates. The generated scenarios also take into account lagging effects, correlation, and unique patterns observed in stress scenarios.
At Scenarios by AI, we provide simulated economic scenarios that capture the complex dynamics of macroeconomic indicators. Reach out to further explore these generated economic scenarios.