We use our latest (as of 2026 Q1) AI-based economic scenario generator (ESG) to generate hundreds of economic scenarios. All generated scenarios are based on the Q4 2025 starting point and cover 20 quarters (5 years). The scenarios have 12 macroeconomic variables:
- Inflation rate
- Unemployment rate
- Treasury 3-month rate
- Treasury 5-year rate
- Treasury 10-year rate
- Mortgage rate
- Real disposable income growth
- Real GDP growth
- VIX (maximum close-of-day value in a quarter)
- S&P 500 growth
- HPI growth
- WTI (oil price)
In the following sections, we illustrate the distributions of economic variables within the generated scenarios. We also analyze their correlations and compare them with the correlations observed in the historical data.
Unemployment Rate
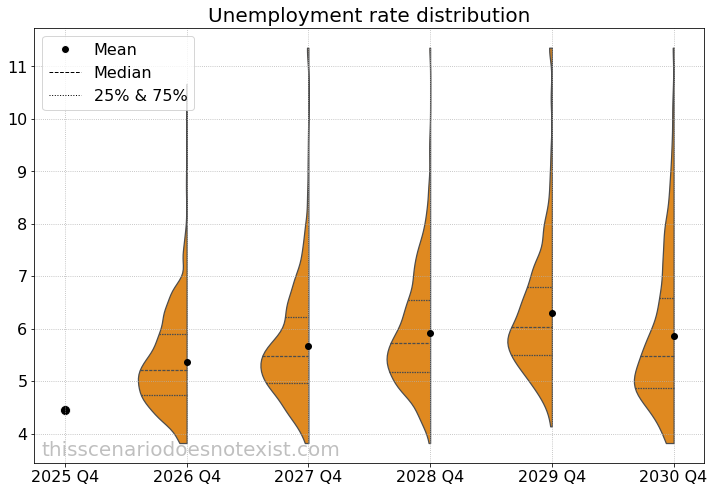
The unemployment rate distributions are concentrated between 4% and 6%, extending toward 7% in later years. The thickening upper tails indicate increasing downside risks to the labor market.
In this and all subsequent distribution charts, values are capped at the 99.5th percentile and floored at the 0.5th percentile to prevent extreme outliers from distorting the visualization.
Treasury 3-month Rate
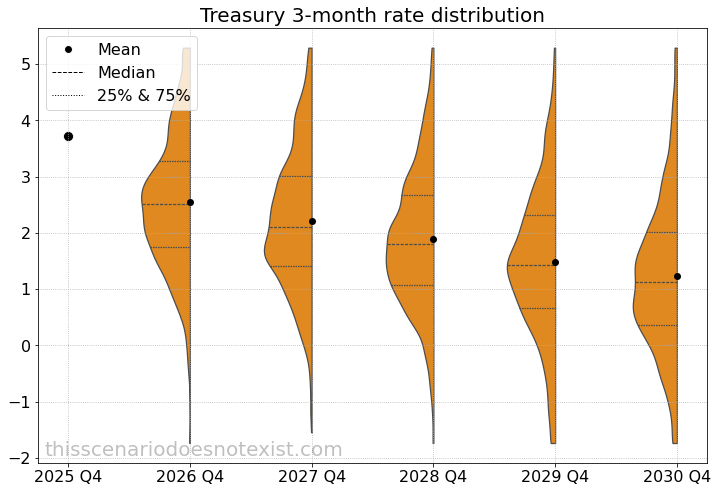
The mean of the Treasury 3-month rate distributions declines over time. The upper tails rise above 5%, while the lower tails fall into negative territory, reflecting the possibility of aggressive monetary easing in severe downturns.
CPI – Inflation Rate
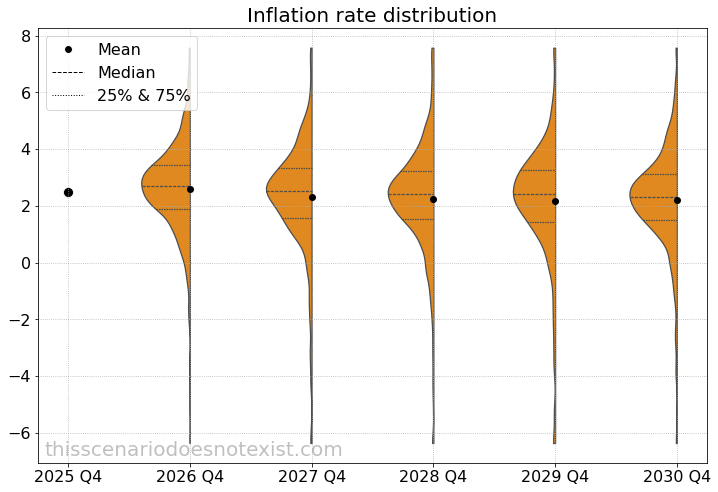
The inflation rate distribution is relatively stable, with mean values hovering slightly above 2%. The upper tail occasionally exceeds 6%, while the lower tail drops below -6%, highlighting the potential for both sharp inflationary surges and rare episodes of outright deflation.
Real GDP Growth Rate
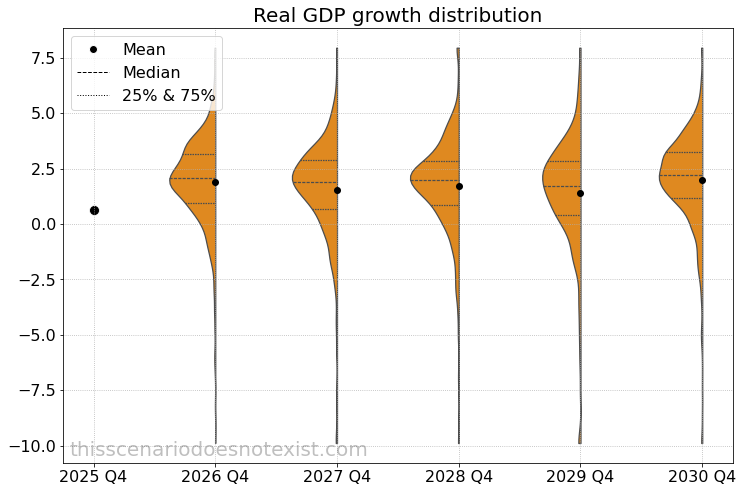
The real GDP growth distribution exhibits a stable mean near 2%, but with substantial tail risk. Upper‑tail realizations surpass 7%, consistent with high‑growth episodes driven by strong demand or productivity surges. Meanwhile, the lower tail extends to –10%, indicating exposure to extreme downside scenarios such as systemic financial stress or abrupt supply‑side disruptions.
HPI – House Price Index
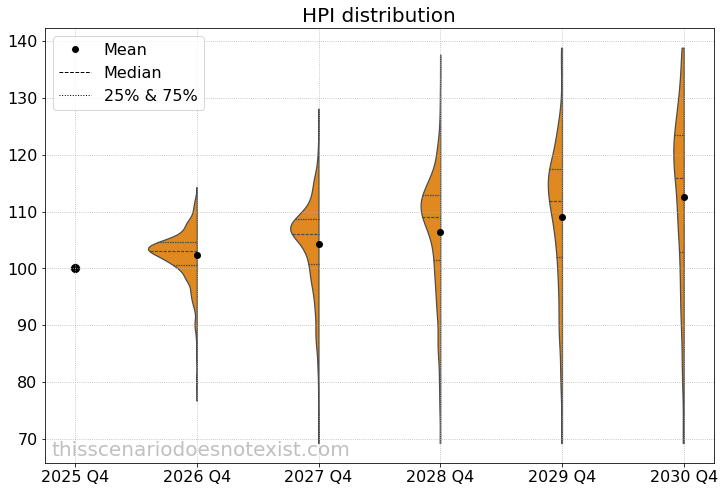
The mean of HPI distributions gradually increases, while the shape of the distributions stretches into both directions over time, signaling the potential for both rapid house‑price appreciation and meaningful downside risk in the housing market.
S&P 500 Index
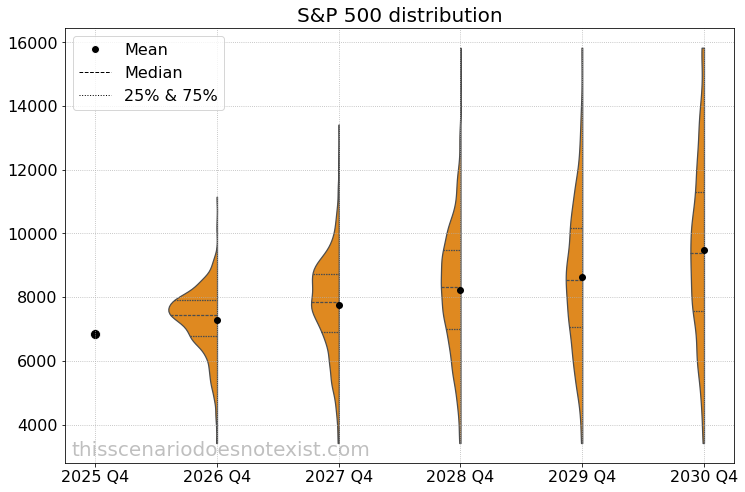
The mean of the S&P 500 index distributions rises steadily at about 9% annual rate. The body of the distributions widens on both sides over time, indicating a growing likelihood of both extended bull markets and deeper market corrections.
Oil – WTI
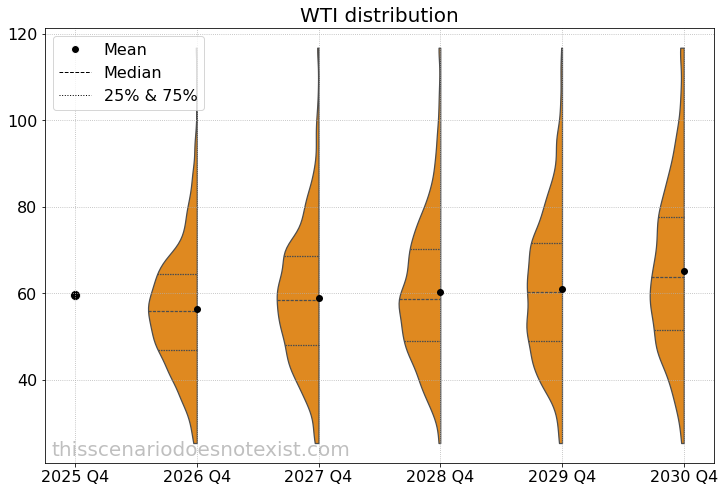
The mean of the oil price distributions remains relatively stable around $60, while the tails stretch above $100 and below $30, signaling the potential for both supply‑driven price spikes and demand‑driven downturns.
Correlation in AI-generated Scenarios
We calculated the average correlations between economic variables across hundreds of generated scenarios. We used Spearman correlation instead of standard Pearson correlation to mitigate the influence of outliers.
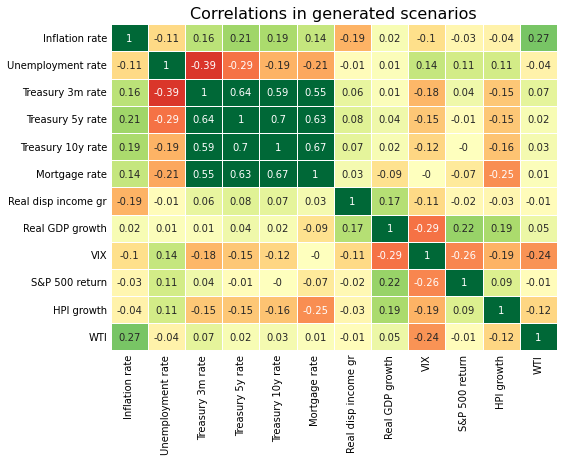
We also calculated the correlations between the economic variables in the historical data.
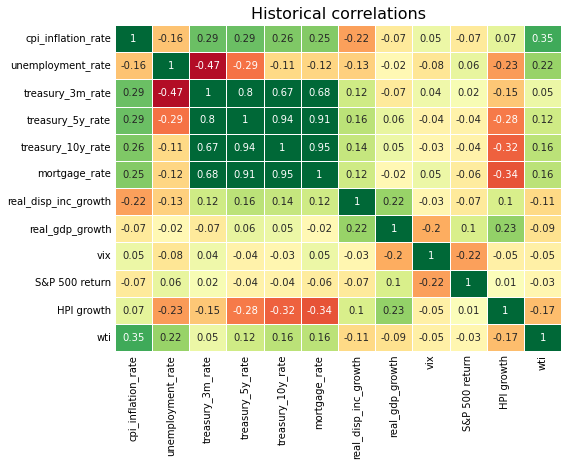
Noticeably, the correlation between HPI growth and the unemployment rate has opposite signs in the historical data and the generated scenarios. We explained this phenomenon in our earlier post.
Can AI‑based Scenario Generators Forecast the Future State of the Economy?
The short answer is no. Our AI-based ESG simulates a broad range of economic scenarios by capturing the complex relationship between economic variables. However, it may have an “opinion” since it incorporates the recent state of the economy, which can influence the near-term dynamics in the generated scenarios.
Summary
The distribution charts demonstrate that the simulated scenarios span realistic and economically consistent ranges for the underlying variables. While it is also essential for the scenarios to be consistent with stylized facts, these empirical patterns are not fully quantifiable. To assess the coherence of the generated scenarios, we compared the correlations of the economic variables with those in historical data. The resulting correlation patterns are broadly consistent with historical relationships.
If you are interested in exploring our AI‑generated economic scenarios, we would be happy to connect.