
We present a few specific economic scenarios and discuss the behavior of macroeconomic variables we observed. The scenario examples discussed here are not cherry-picked but rather randomly selected from thousands of scenarios generated by our proprietary AI model.
In all illustrated economic scenarios, 2024 Q4 is the last actual period, and 2025 Q1 is the first generated period. For this discussion, we limited the scenario examples to 4 years.
The illustrations of prior year economic scenarios are available under 2024 scenarios.
Severe Adverse Scenario
The first generated economic scenario is a recession, somewhat similar to FRB‘s severe adverse scenario. However, unlike the FRB scenario where the recession starts right out of the door, in the generated scenario the downturn starts a year later as it takes time to develop the right preconditions.
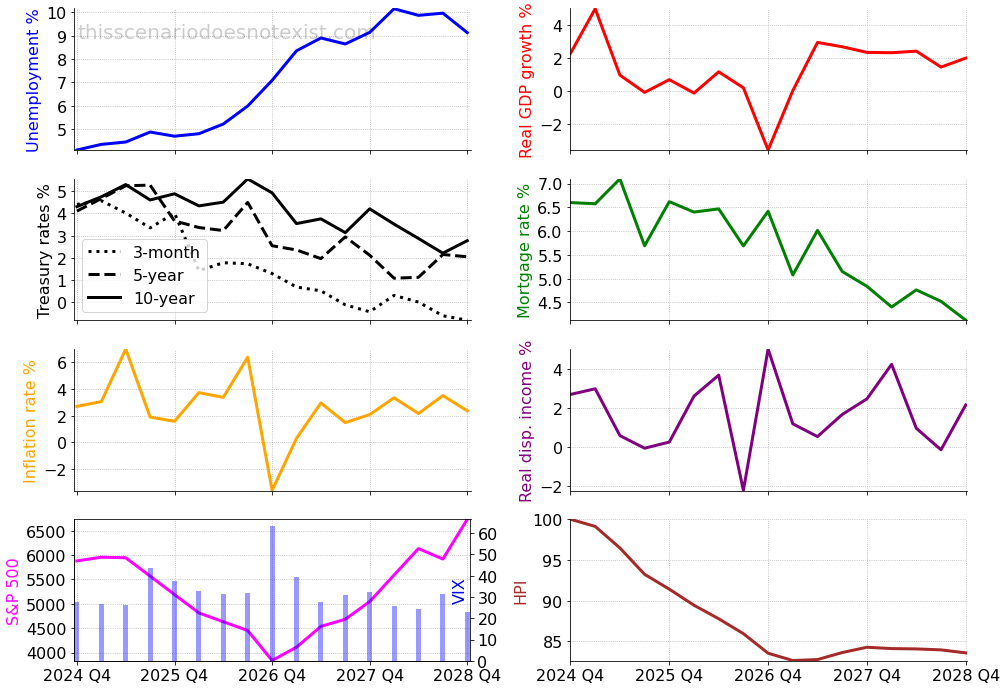
The unemployment rate steadily increases to 10% while the Treasury 3-month rate decreases to a near-zero level and even dips into the negative territory.
The inflation rate spikes a couple of times during the first two years of the scenario, then sharply turns into deflation due to a deepening recession. It settles down at around 2.5% level in the second half of the scenario.
GDP growth rate declines to a near-zero level and then drops to -4% at the end of the second year. It recovers during the third year of the scenario and stabilizes at a 2% level.
The stock market declines 34% during the first half of the scenario, then recovers in the second half. The VIX spikes above 60 at the trough of the stock market.
House Price Index (HPI) declined 16% due to the economic downturn and remains at a near-trough level till the end of the scenario. The mortgage rate declines following the decrease in the 10-year Treasury rate.
Real disposable income growth shows high volatility during the scenario often touching the %0 level and even declining 2% in one period.
Tug-of-war Scenario: Inflation vs Interest Rate
In the second economic scenario, the Treasury 3-month rate repeatedly decreases and then increases to conquer the stubborn inflation.
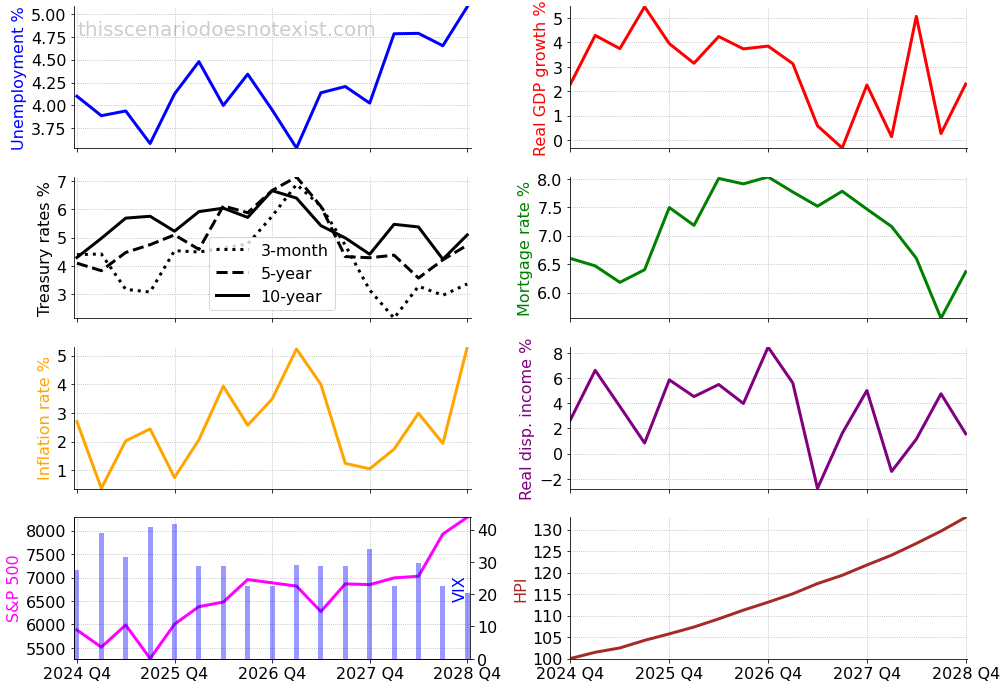
The 3-month Treasury rate increases to 7% to control the rising inflation rate, then decreases as the inflation slows down to about 1%. In the last year of the scenario, the inflation rate increases again and the Treasury 3-month rate starts to pick up.
While the economy successfully absorbed the higher borrowing costs during the first half of the scenario, it started to deteriorate during the second half. The unemployment rate steadily increased from 3.5% to 5% and GDP dropped to a near-zero level.
The real disposable income decreases in the second half of the scenario reflecting the slower economic growth.
The volatile stock market has an overall 38% growth during the scenario with higher VIX during the first year due to mostly declining S&P 500 index.
HPI steadily increased around 33%, supported by a mostly well-performing economy. Besides, the high mortgage rates resulted in constrained housing supply which also stimulated HPI growth.
Mild Recessionary Scenario
In this scenario, the economy experiences a slowdown. The unemployment rate gradually increases reaching 6.5% in the third year of the scenario, then decreases to 4.5% at the end of the scenario.
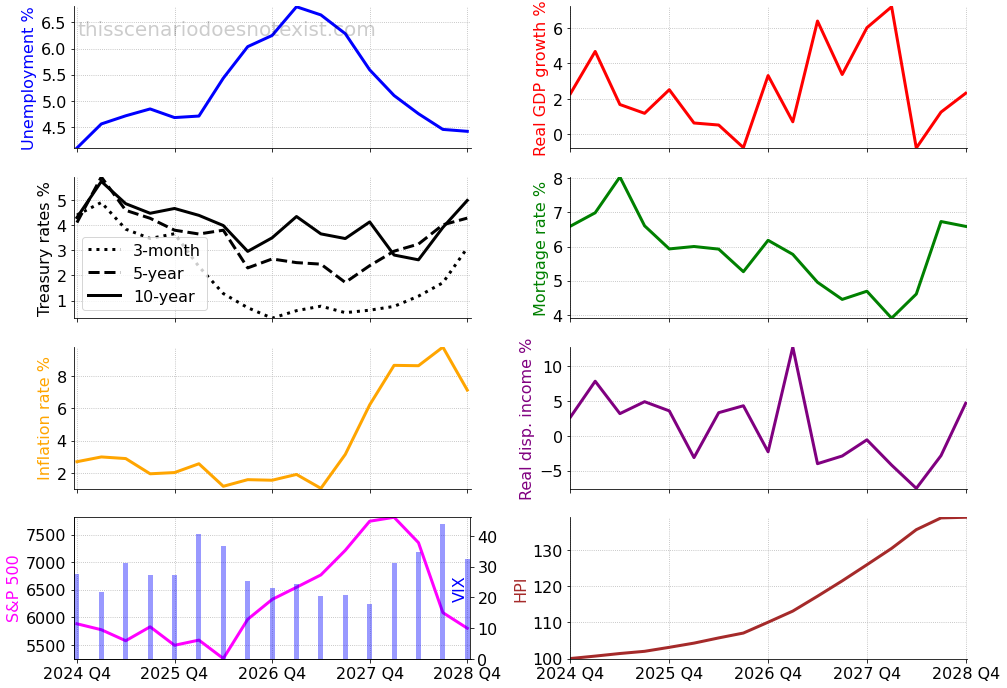
The 3-month Treasury rate decreases to a near-zero level to boost the economy during the downturn. As employment recovers, the inflation rate starts to increase, reaching 9% towards the end of the scenario. Consequently, the Fed tightens the monetary policy resulting in the 3-month Treasury rate increase to 3%.
Real GDP growth slows down and then briefly turns negative as economic activity declines. Then in the second half GDP starts to grow reaching as high as 7% growth supported by low interest rates. However, towards the end of the scenario, the real GDP growth slows down again due to rising interest rates and high inflation.
The stock market declines due to economic slowdown, then revives in anticipation of the economic recovery. At the end of the scenario, the S&P 500 index sharply declines due to rapidly rising interest rates and concerns about economic growth. The VIX increases to above 40 during the stock market decline and drops back to teens during the market revival.
The HPI had a slow gain during the first half of the scenario due to worsening economic conditions. It accelerates during the second half supported by the strong economic recovery. However, HPI flattens at the end of the scenario due to high mortgage rates and a decline in real disposable income.
Soft Landing Scenario
In this economic scenario, the inflation rate is mainly trending down due to relatively high interest rates during the first half of the scenario. In the second half of the scenario, the Treasury 3-month rate decreases causing a temporary bump in inflation.
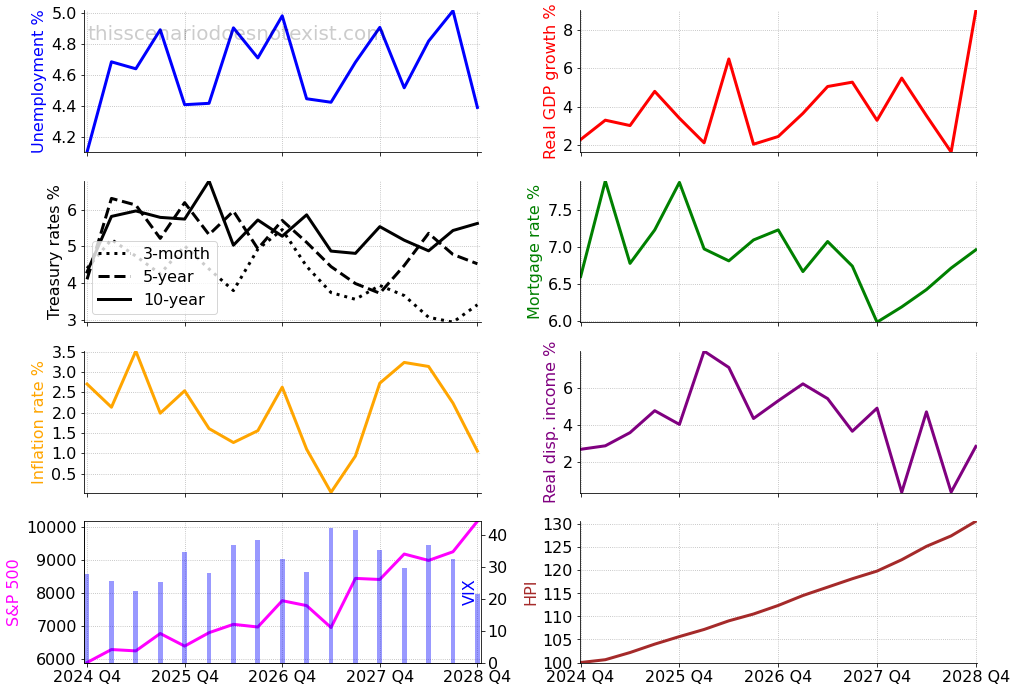
The unemployment rate slightly increases from the initial 4.1% level and then fluctuates between 4.4% and 5%.
The stock market overall performs well with S&P 500 index rising 67% at the end of the scenario. VIX remains slightly elevated reflecting the uncertainty around the monetary policy and its impact on the stock market.
The real GDP shows solid economic growth. Similarly, real disposable income exhibits strong growth reflecting the robust economy.
HPI steadily increases reaching an overall 30% growth at the end of the scenario. It is likely driven by the relatively high mortgage rates which caused a tight housing supply as well as strong demand driven by the healthy economy.
Conclusion
The illustrated scenario examples produced by our AI-based economic scenario generator are coherent and dynamic. They maintain a reasonable relationship between macroeconomic variables and adhere to stylized facts such as the relation between inflation and short-term interest rates. The generated scenarios also take into account lagging effects, correlation, and unique patterns observed in stress scenarios.
At Scenarios by AI, we provide simulated economic scenarios that capture the complex dynamics of macroeconomic indicators. Reach out to explore how these generated economic scenarios can help you enhance your portfolio risk management.